> ## Documentation Index
> Fetch the complete documentation index at: https://docs.n-3.co.uk/llms.txt
> Use this file to discover all available pages before exploring further.
# Common Elements
> There are a collection of common elements used throughout the N3 platform
To help you ge familiar with a lot of common elements and concepts, we have compiled a list of things you will see throughout the UI.
## Stat Ribbons
These are a series of stats that are displayed at the top of dashboard views or tables to help summarise key metrics.
 Stat ribbons adapt to data changes via filters and settings. Some pages might have ellipsis `⋯` buttons which offer view options for you to use.
## Ratio Bars
These are used to show how much of each value is proportional to the total and are used when displaying GDV and other values.
Stat ribbons adapt to data changes via filters and settings. Some pages might have ellipsis `⋯` buttons which offer view options for you to use.
## Ratio Bars
These are used to show how much of each value is proportional to the total and are used when displaying GDV and other values.
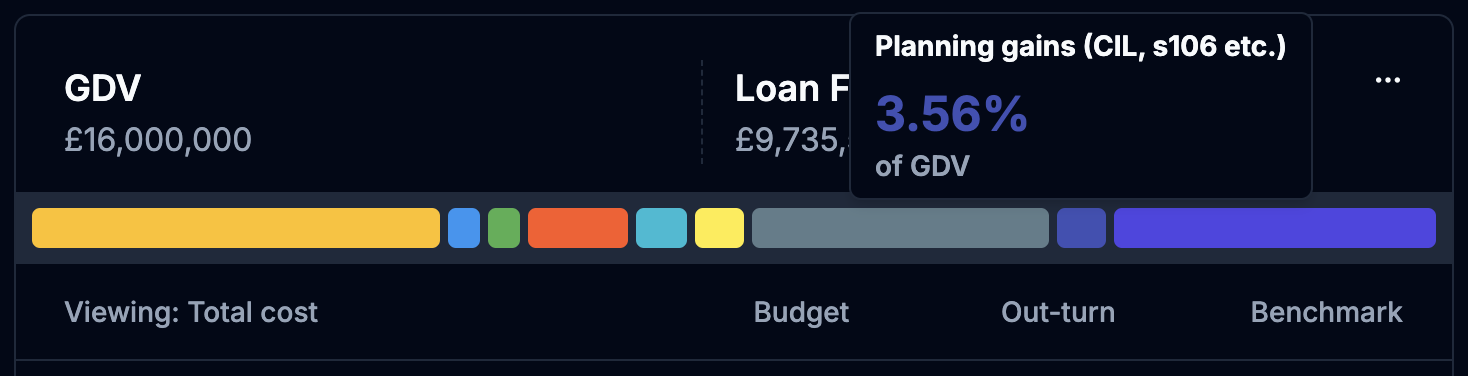 Hovering over a coloured bar will display a tooltip to display the ratio percentage and details about the value.