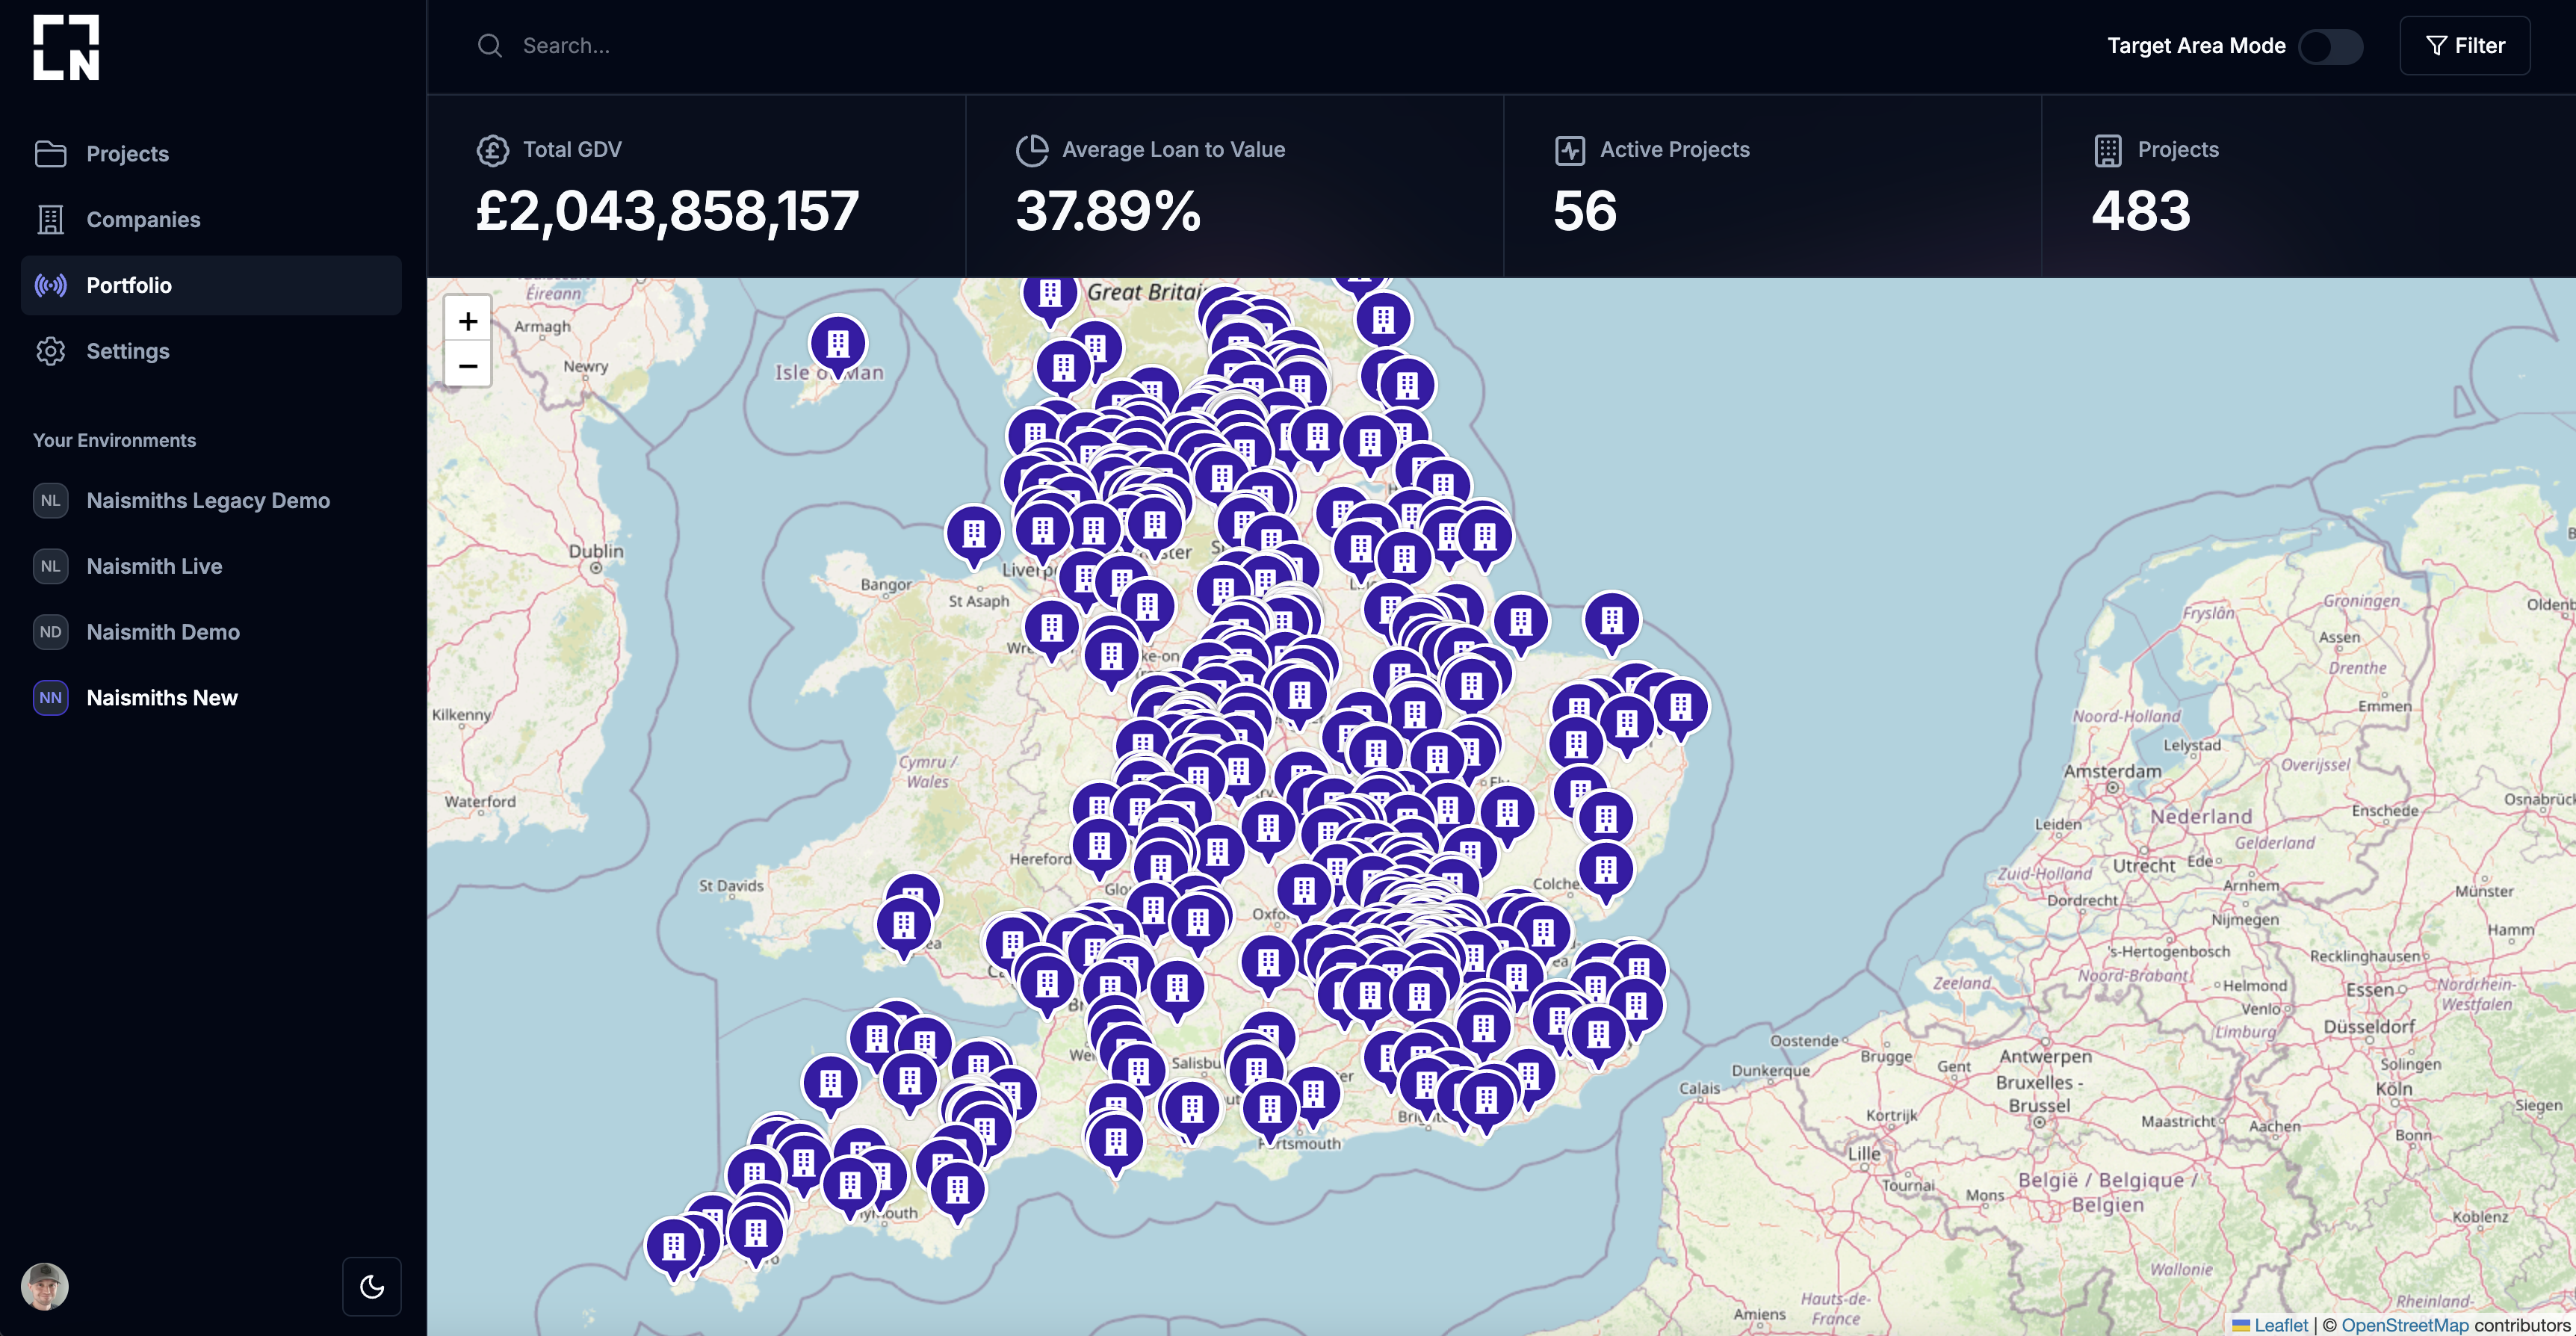
- Geographical representation of your projects
- Filter based on project features and GDV
- Highlight important insights
Target Area Mode
By toggling on target area mode you will be able to click on the map and drop a target pin. The portfolio will then only show projects within a certain distance from that pin. Thestat ribbon will then update statistics based on visible projects.
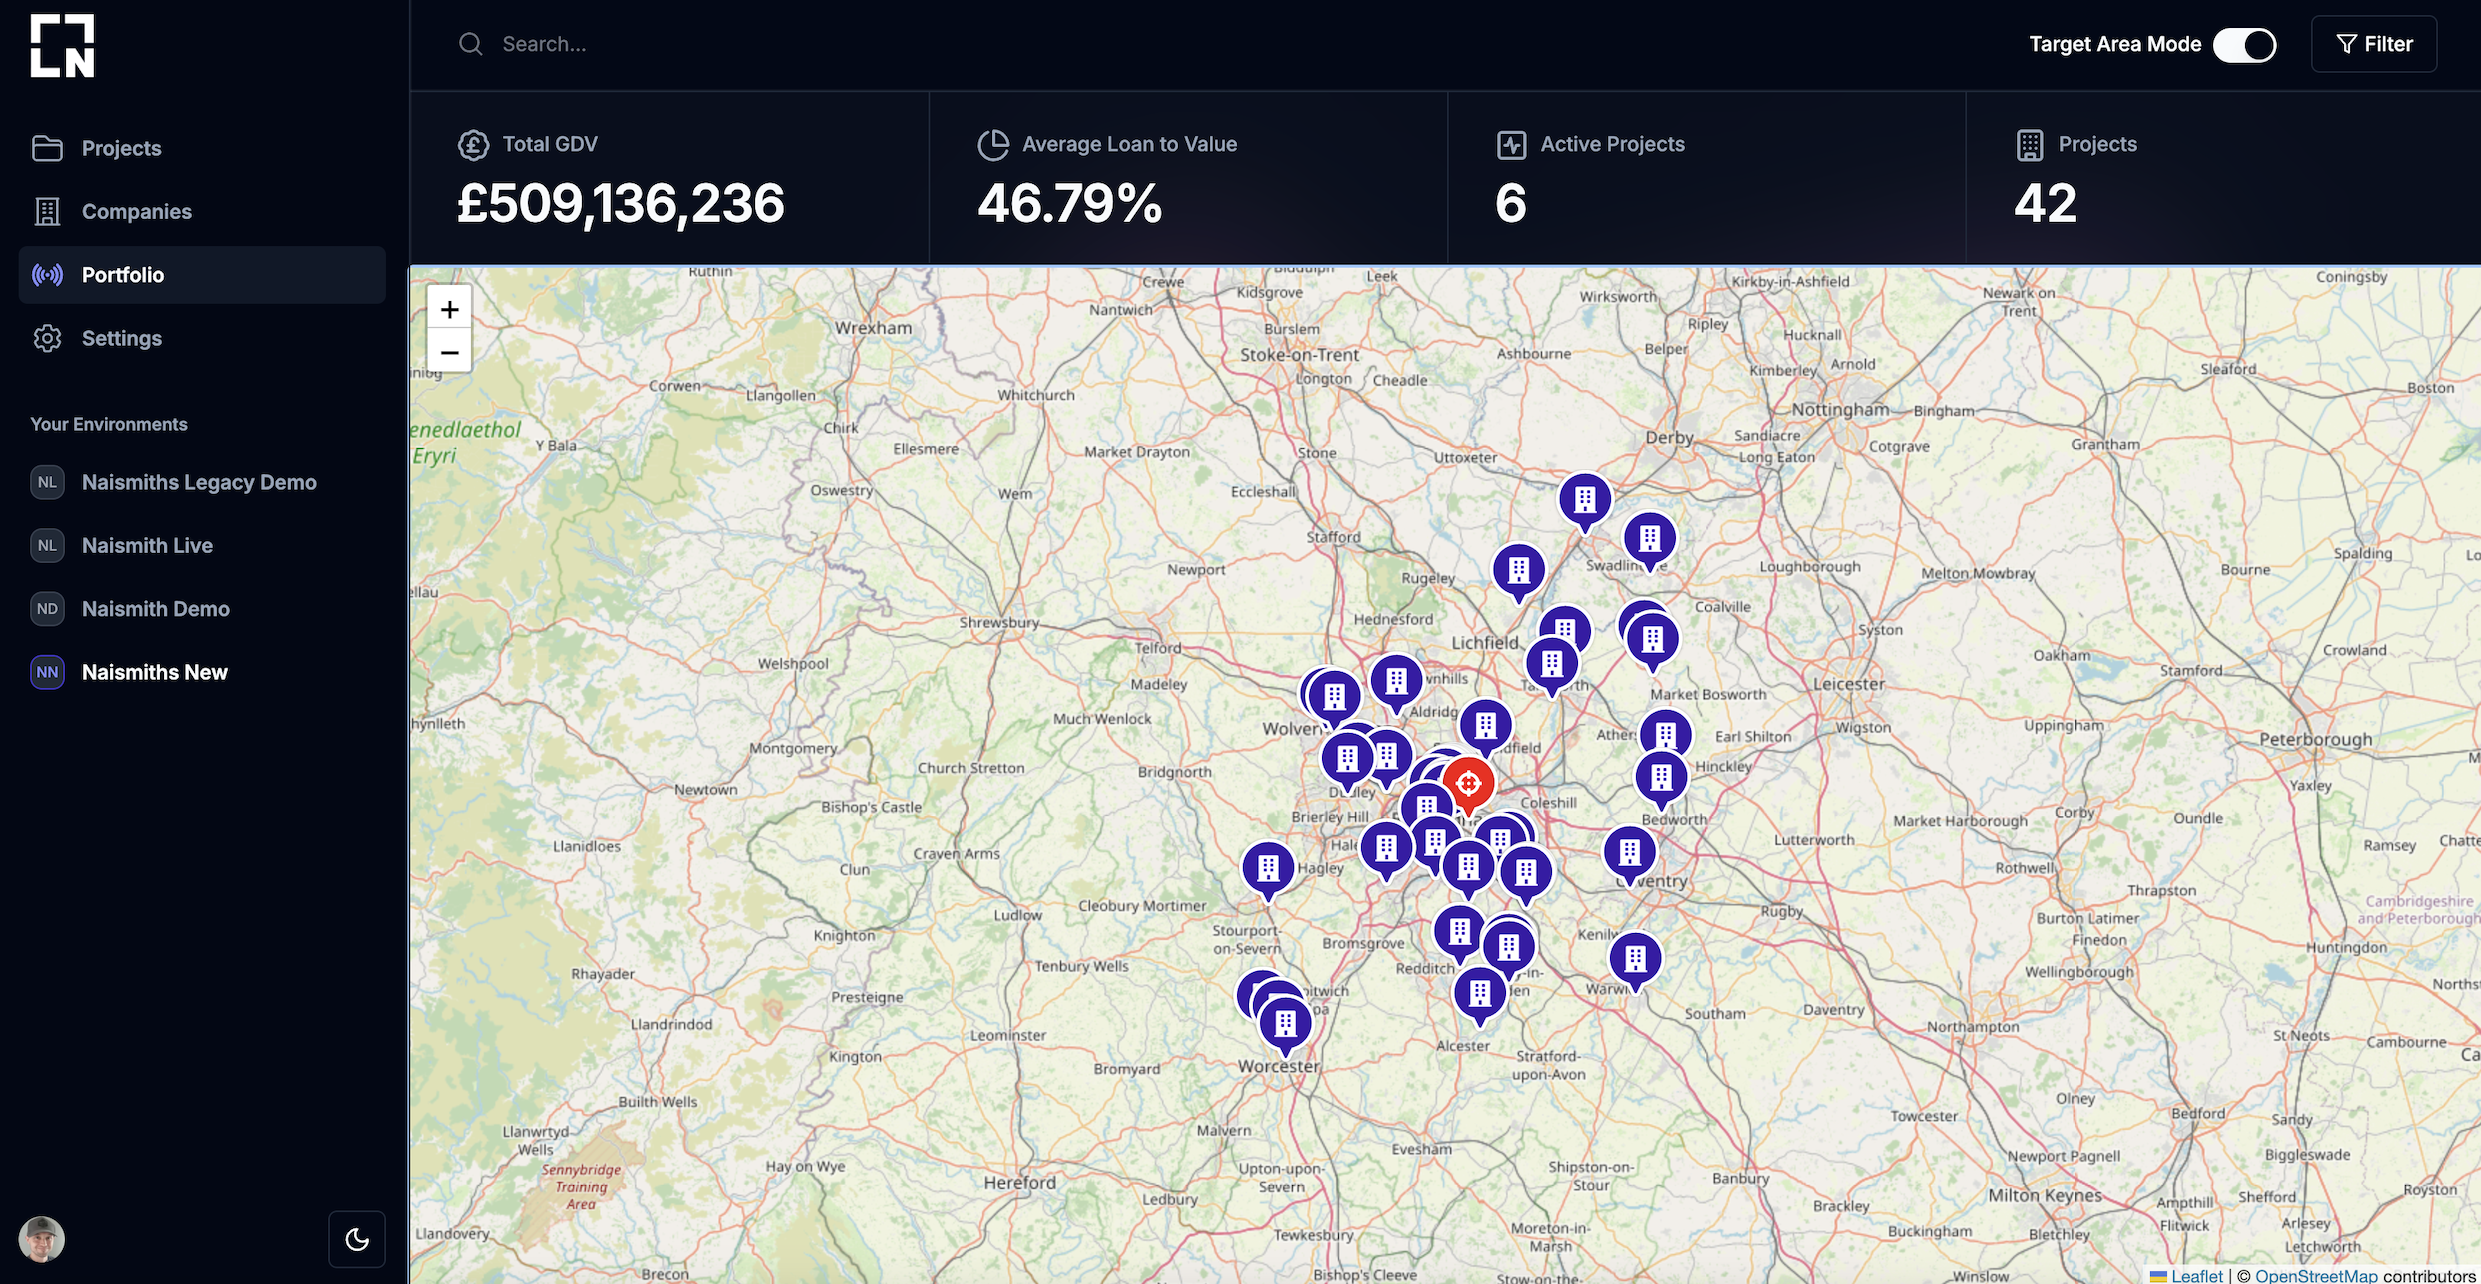
You can change the distance to filter from the area pin using the portfolio
filter controls.
Filter Controls
N3 provides a series of filter controls for your portfolio.The number in miles from the pin.Example:
25Choose from the dropdown which business function to filter for projects. If a project has the function then they will be selected for the portfolio view.Example:
ResidentialChoose from the dropdown which business purposes to filter for projects. If a project has the purpose then they will be selected for the portfolio view.Example:
New-BuildThe min and max of the GDV to filter projects.Example:
£0, £1,000,000