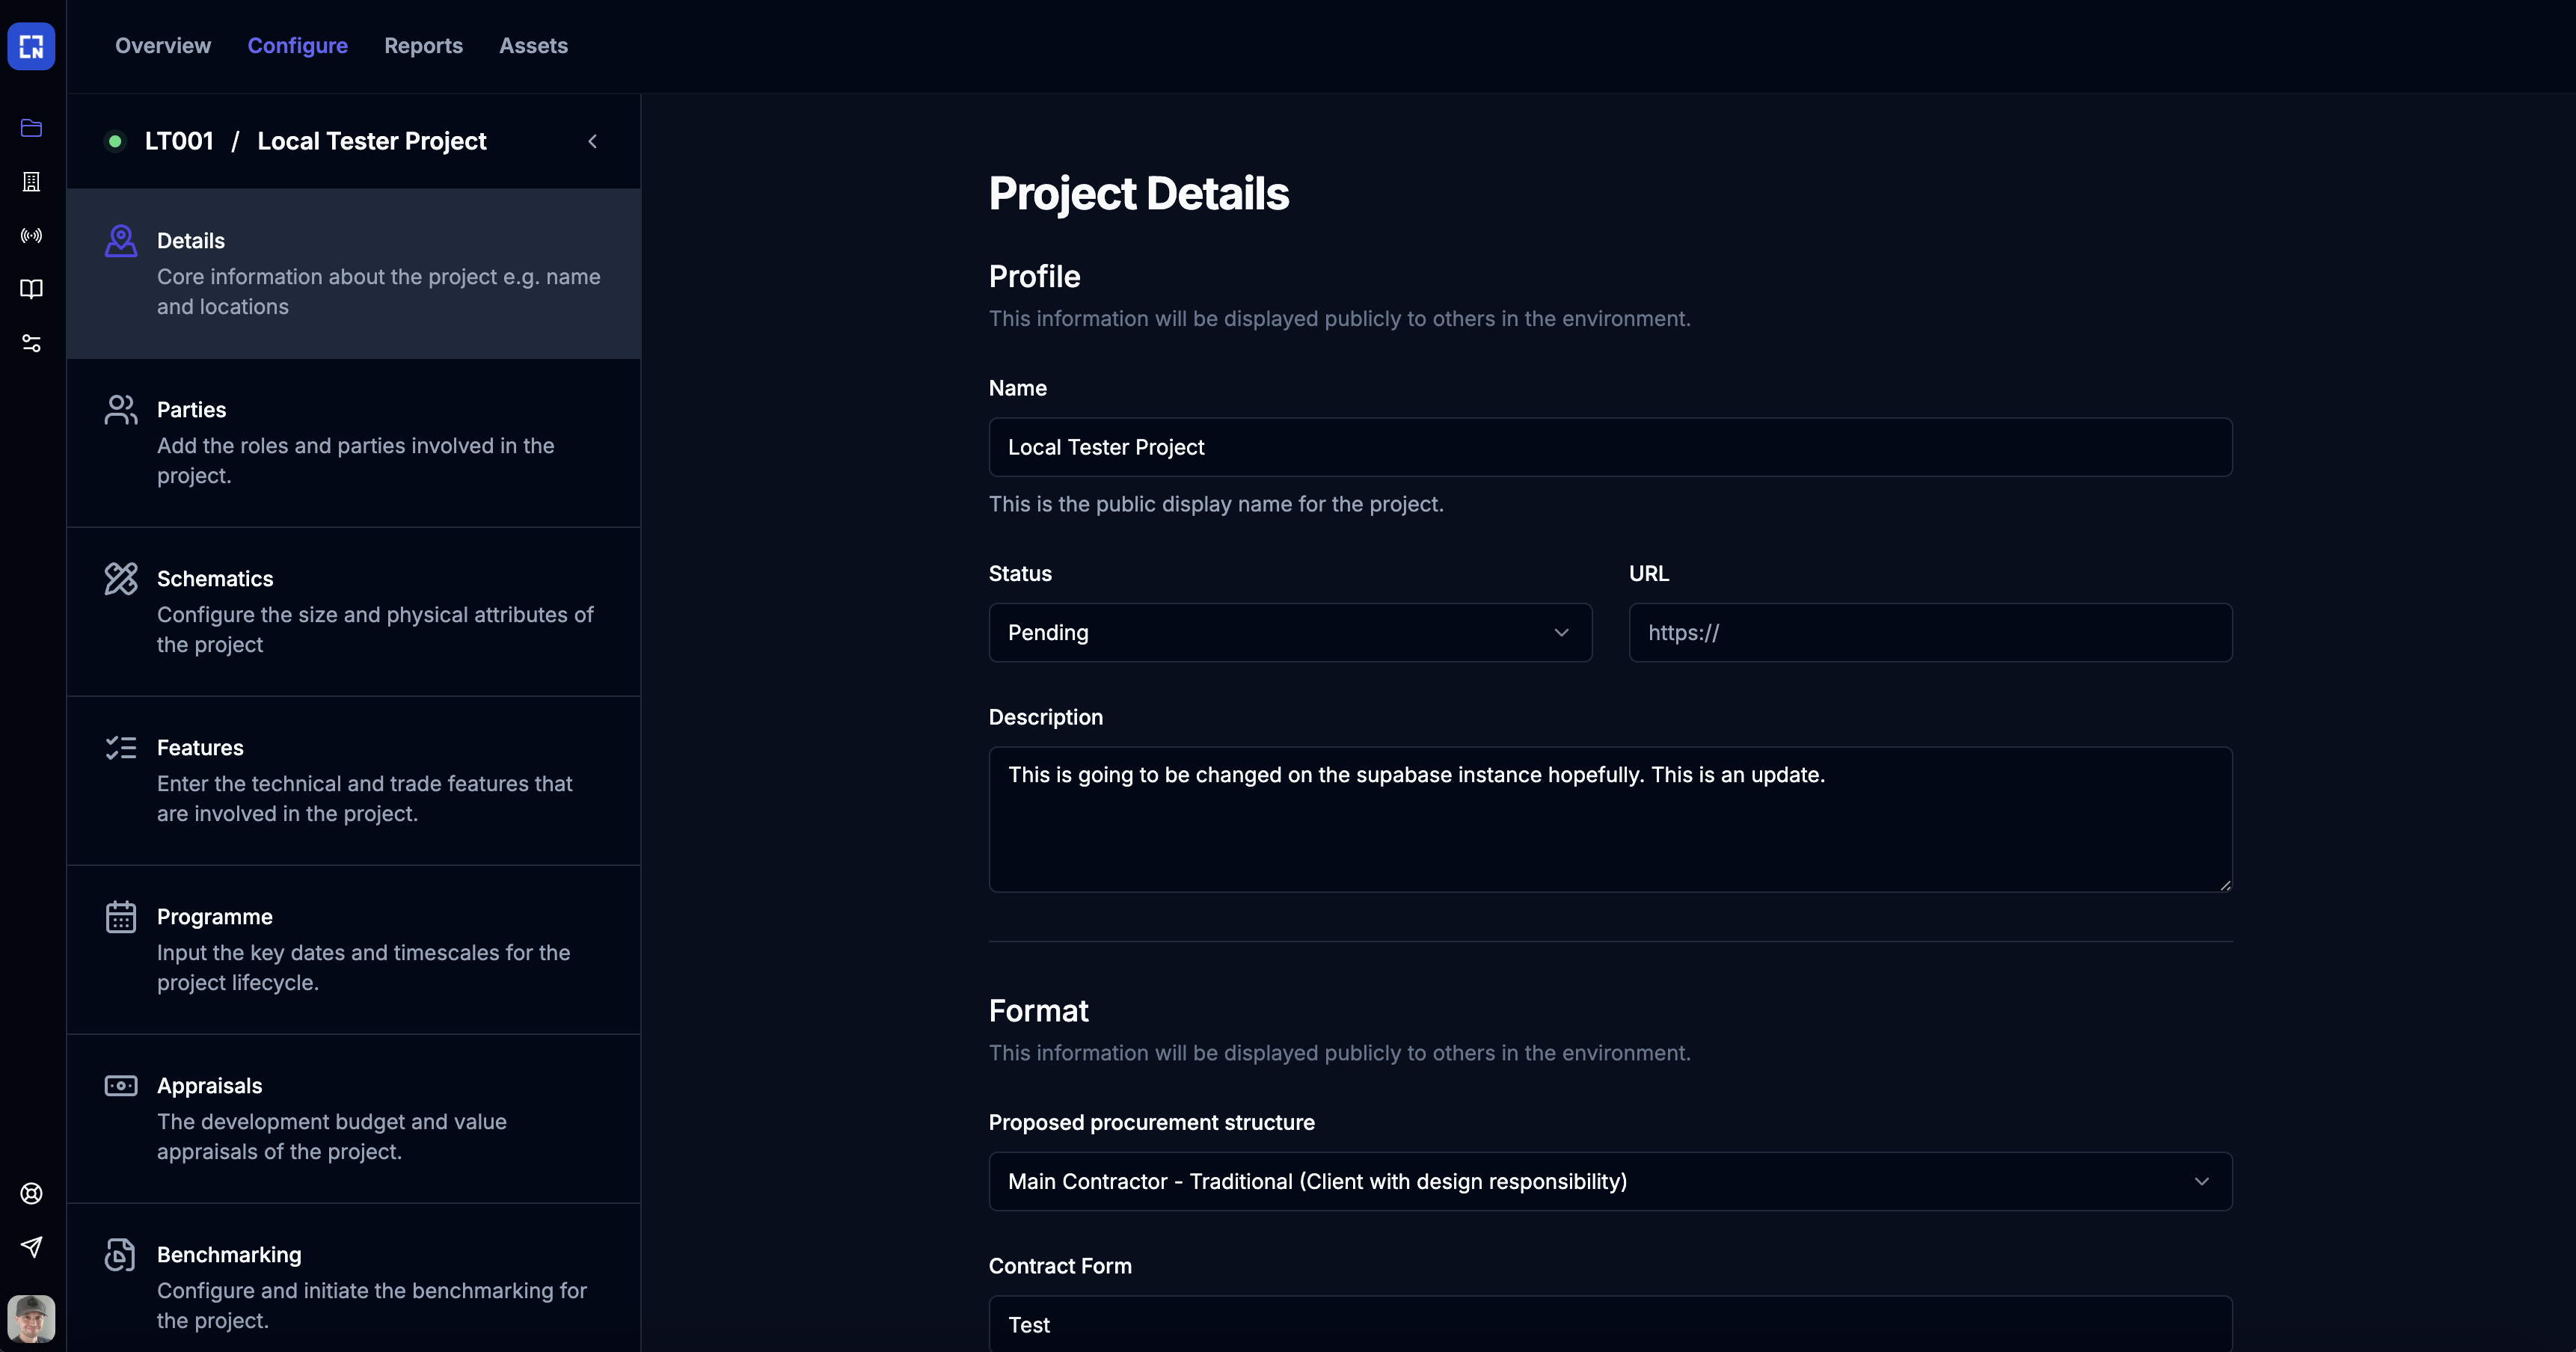
Details
This section is all about the basic details of the project. You can use a postcode to find thelatitude and longitude of the project so the platform can recognise its location.
A map visual is made available so you can check the location fits your expectations.
Parties
This section is all about the companies involved in the project, to form a project directory. Information provided will be included in the initial report, and you can add a point of contact for each party involved.List
This is the list of party members. You can add new party members here and remove them.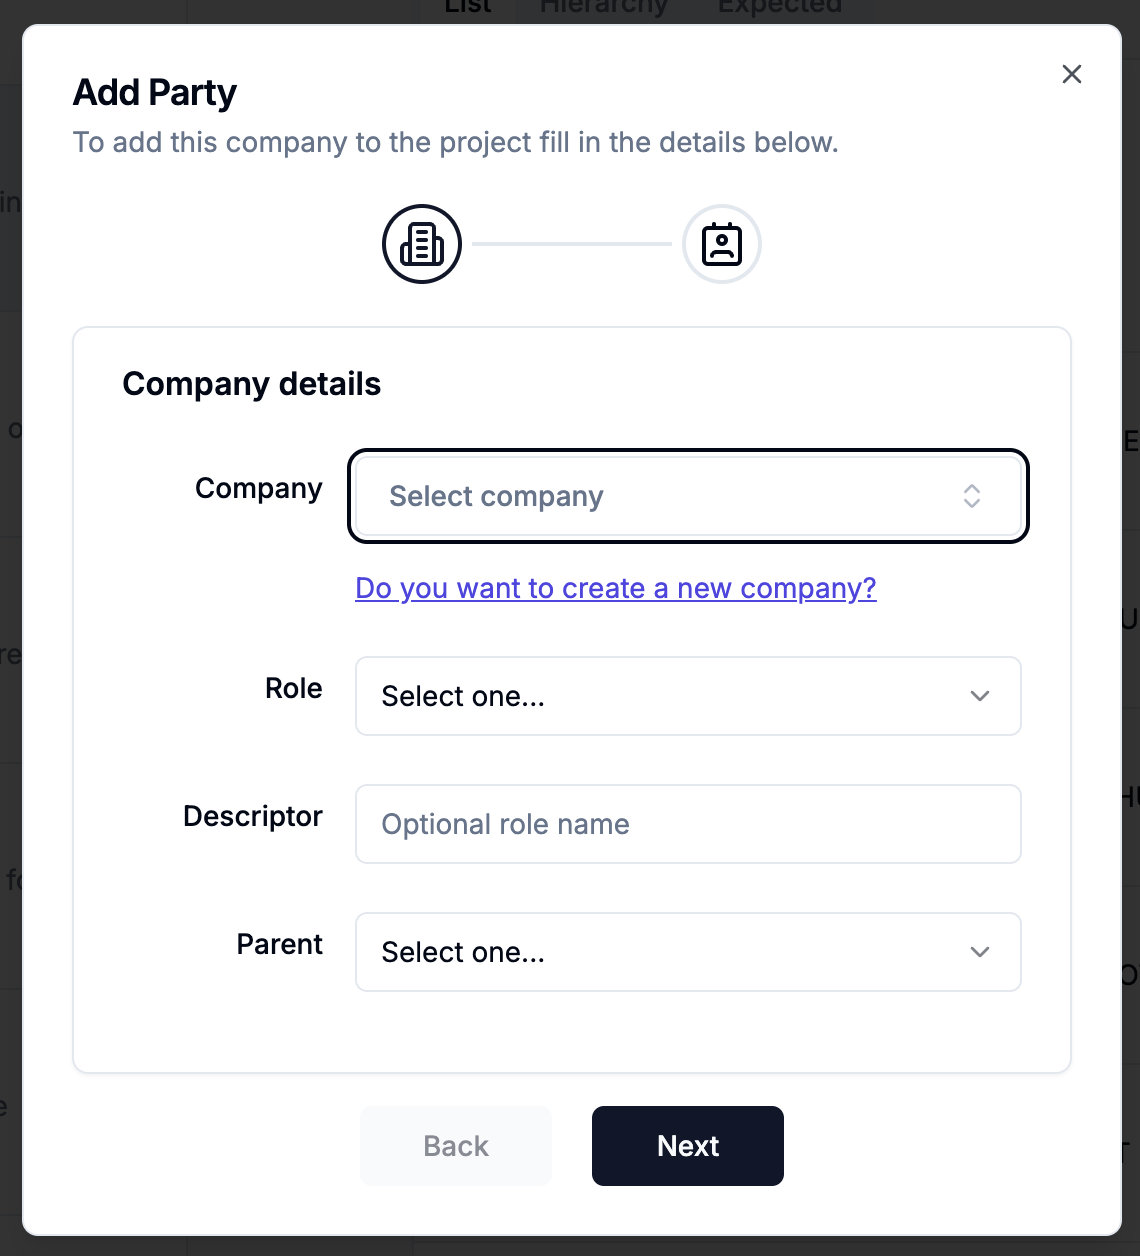
- Company name (selected from a dropdown of companies from the environment)
- Role in the project (dropdown, though
otheris available) - Descriptor (this is the description of the role and will replace its name in charts and tables)
- Parent (This is the party who manages the entity and will be higher in the hierarchy chart)
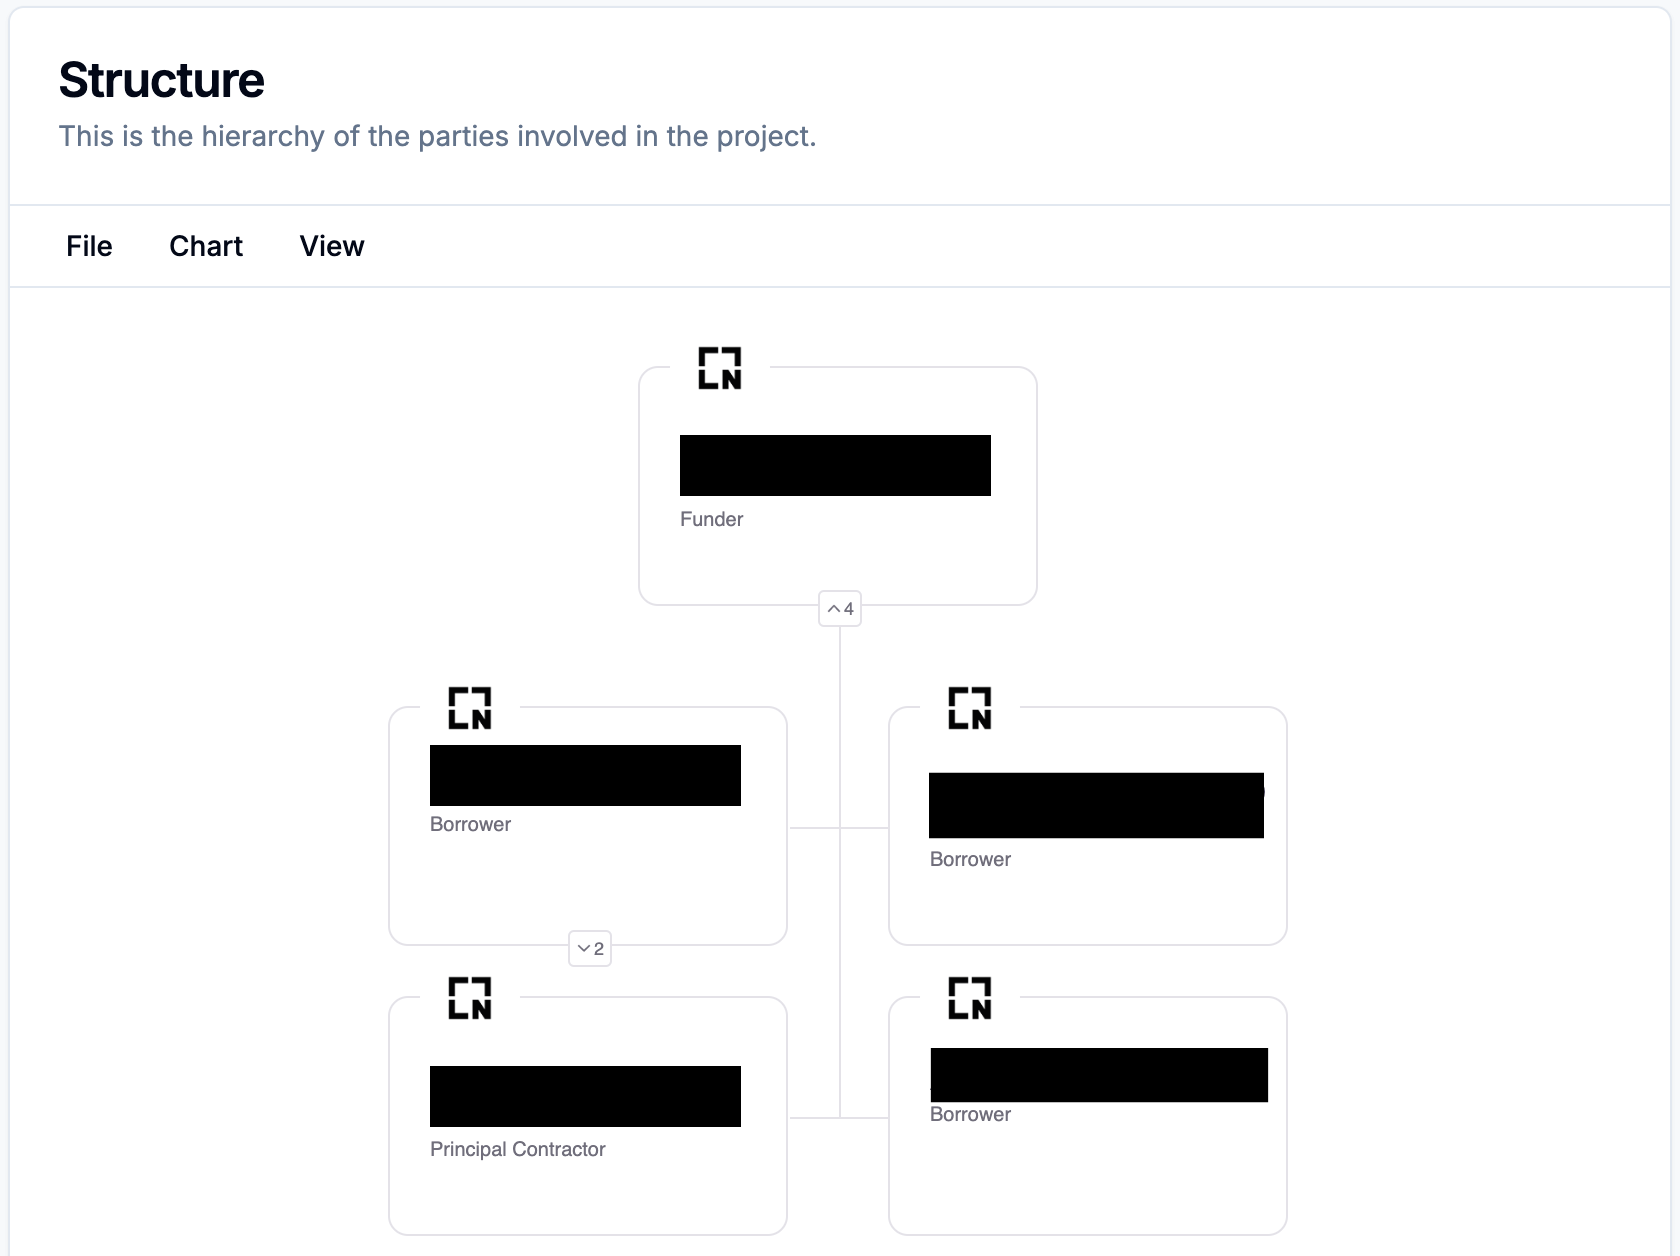
Hierarchy Chart
Expected
This is an upcoming feature where N3 will be able to show you the expected
contractors/skillsets required for the project based on data provided.
Schematics
Information captured here concerns the site and dimensions of the construction. This information is important for benchmarking as many factors here have significant impact to the cost calculations of the project. Number of units is a value that is important for certain projects, for example, residential apartments. When using theshow by functional unit view option of projects, this value is used to show the footprint or construction costs per unit.
Features
These items include key elements of a project which contribute to the risk metric score and benchmarking tooling used throughout N3. The more features you can identify for the project, the better the analytics will be.These features will be used for comparison against other projects to try
identify similarities and characteristics between them while evaluating risk
and budgets.
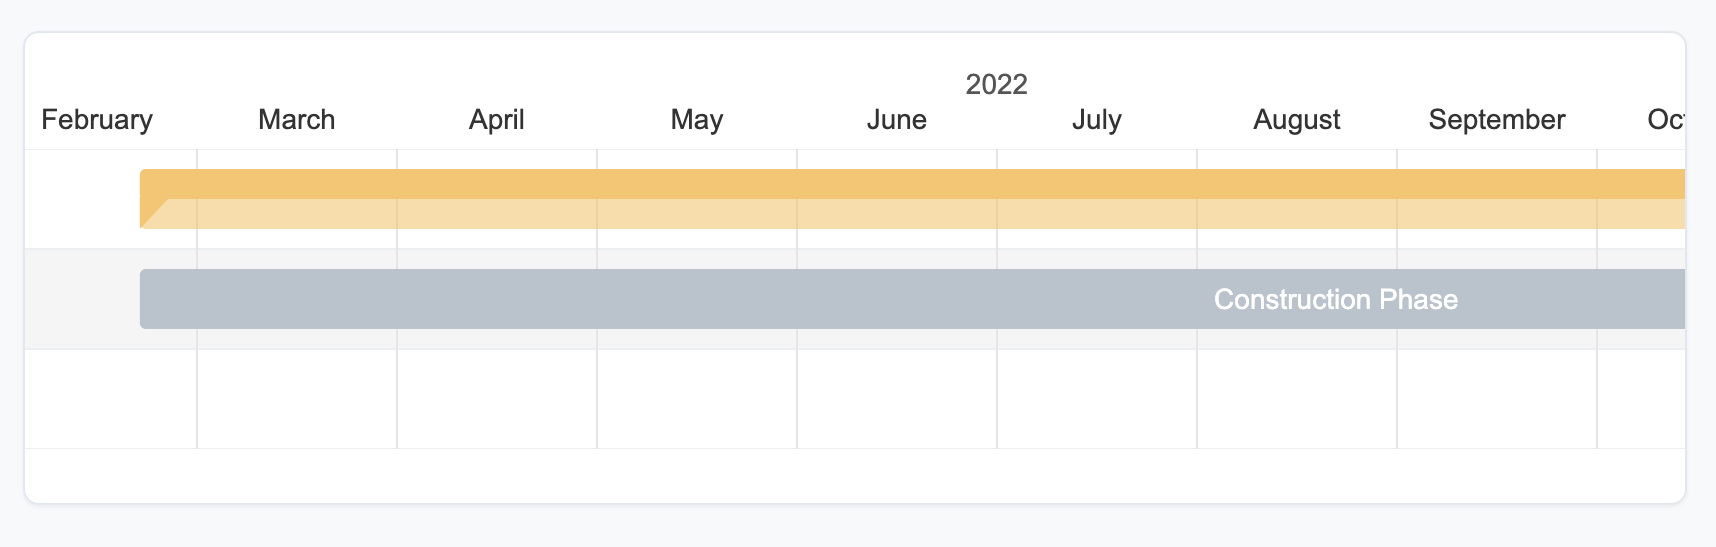
Programme
Appraisal
This is the data from the developer of the costs involved in the project. This will be used for comparison as a baseline for the cost benchmarking. Providing the GDV and loan facility will also allow for more comparison metrics to be available.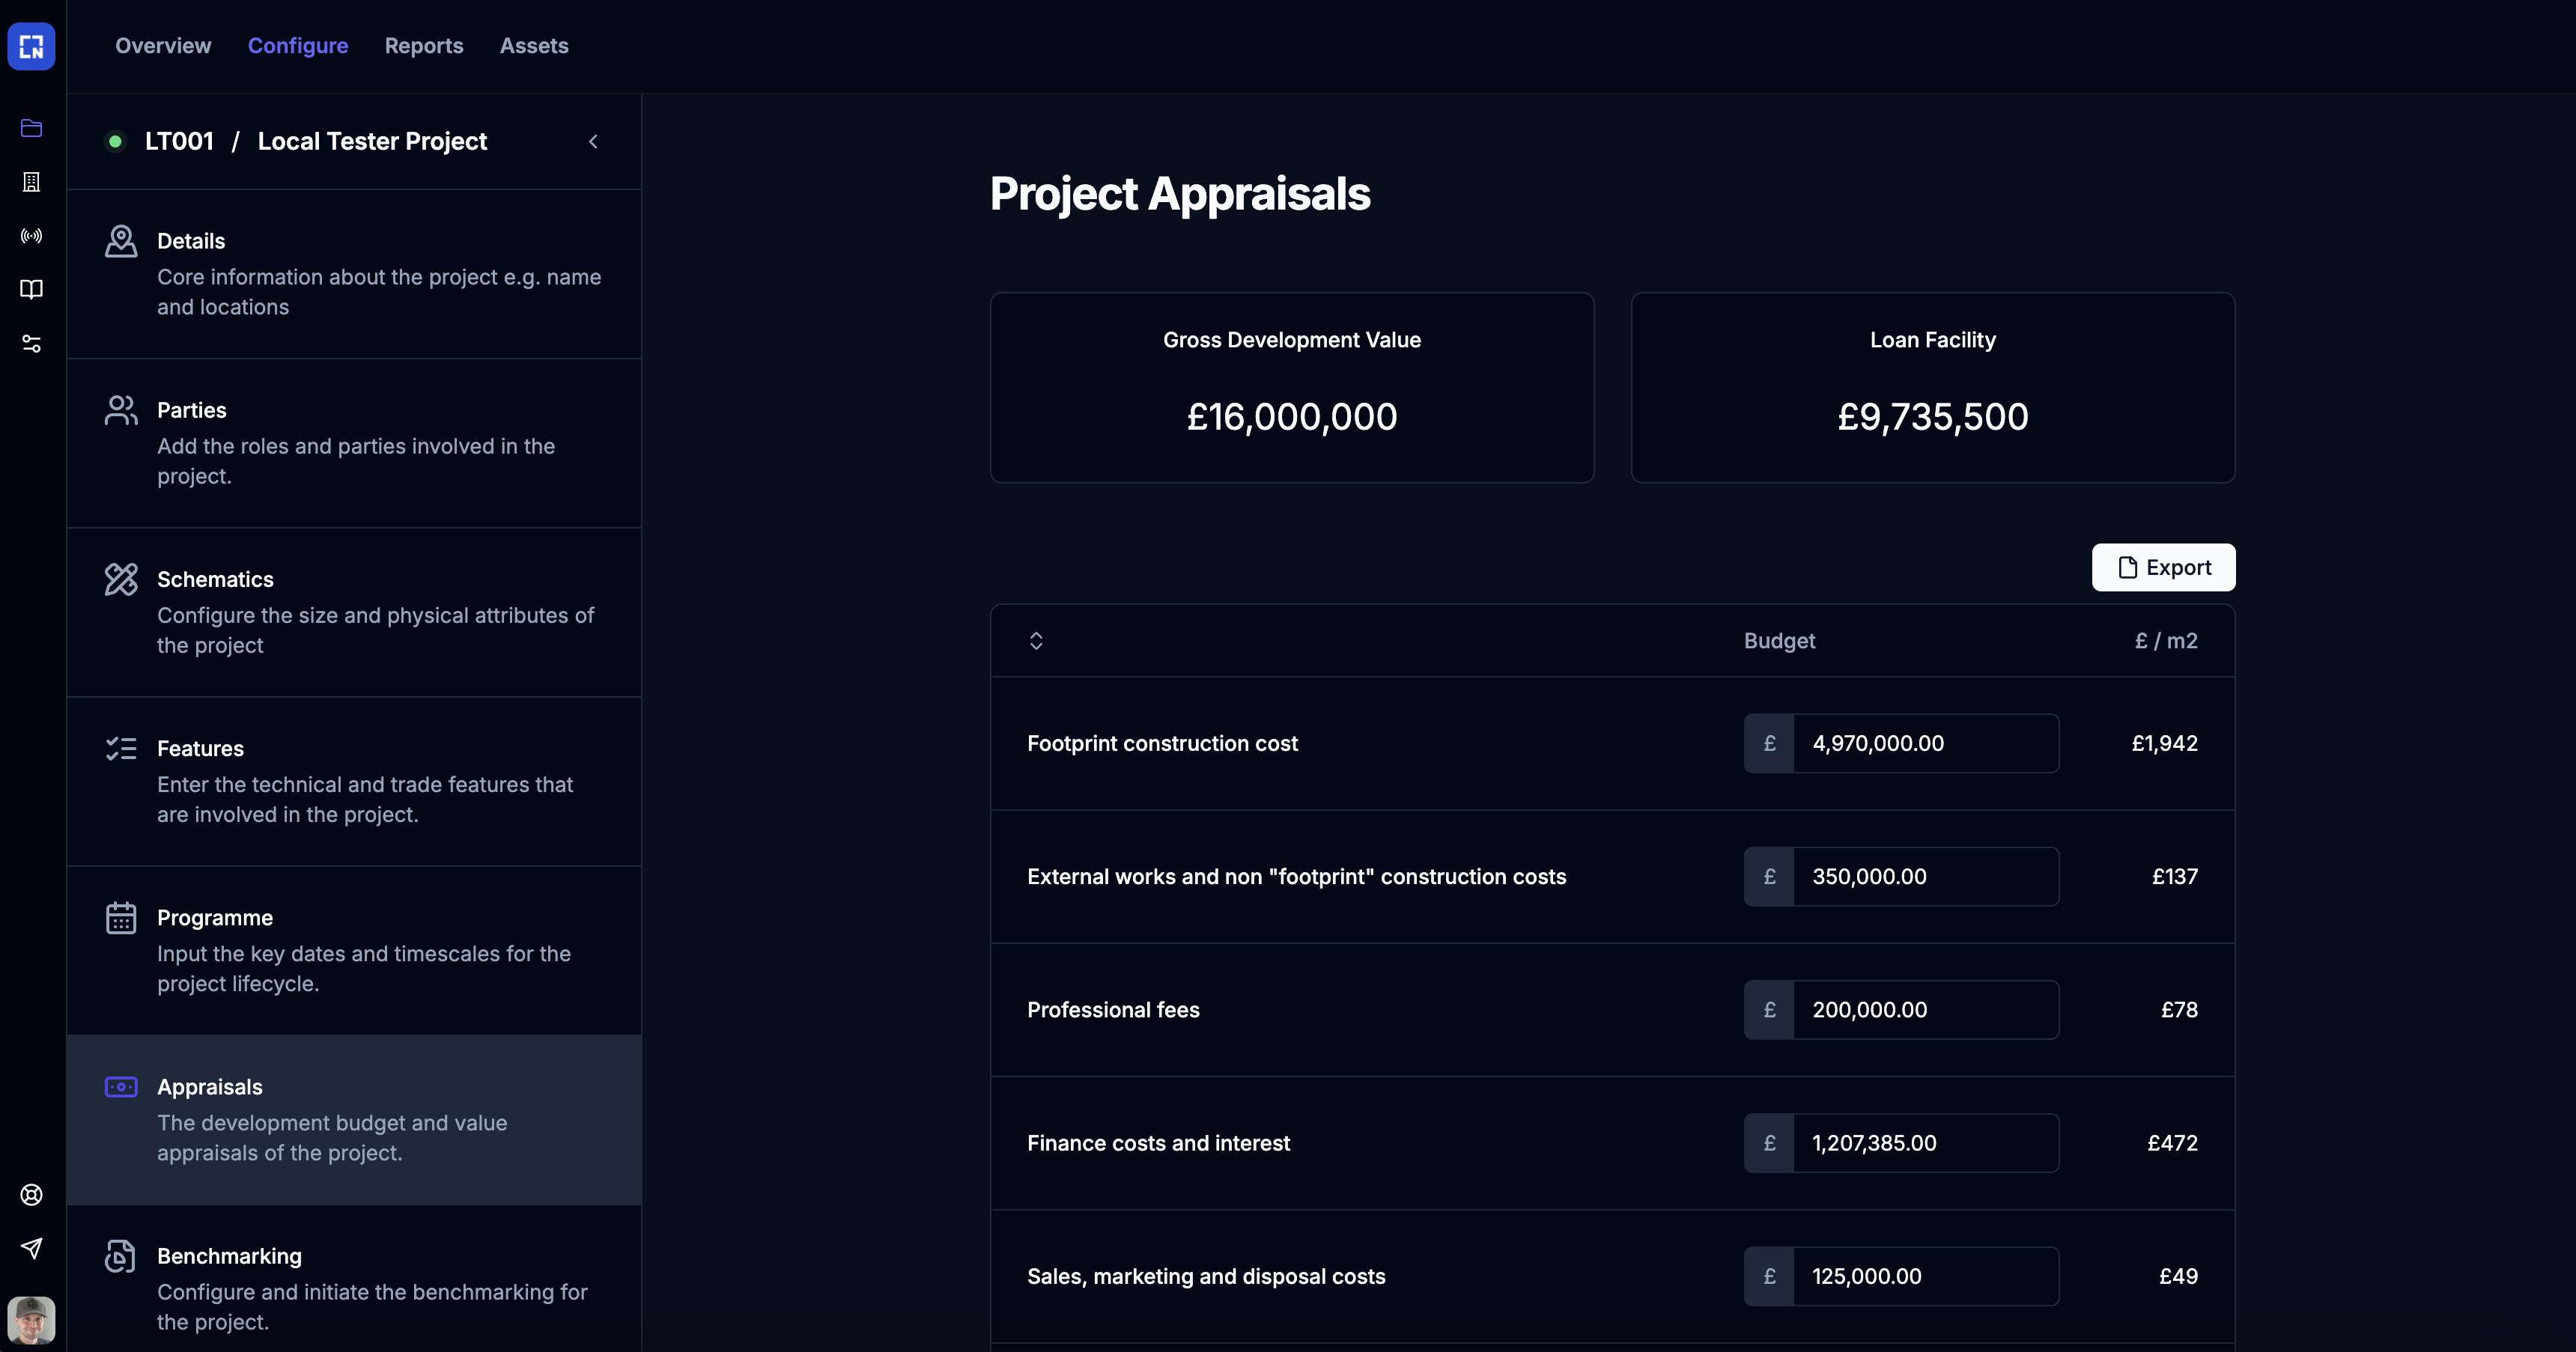
Table data can be exported as CSV.
Benchmark
Once you have added enough information into the platform you will be able to generate benchmark reports.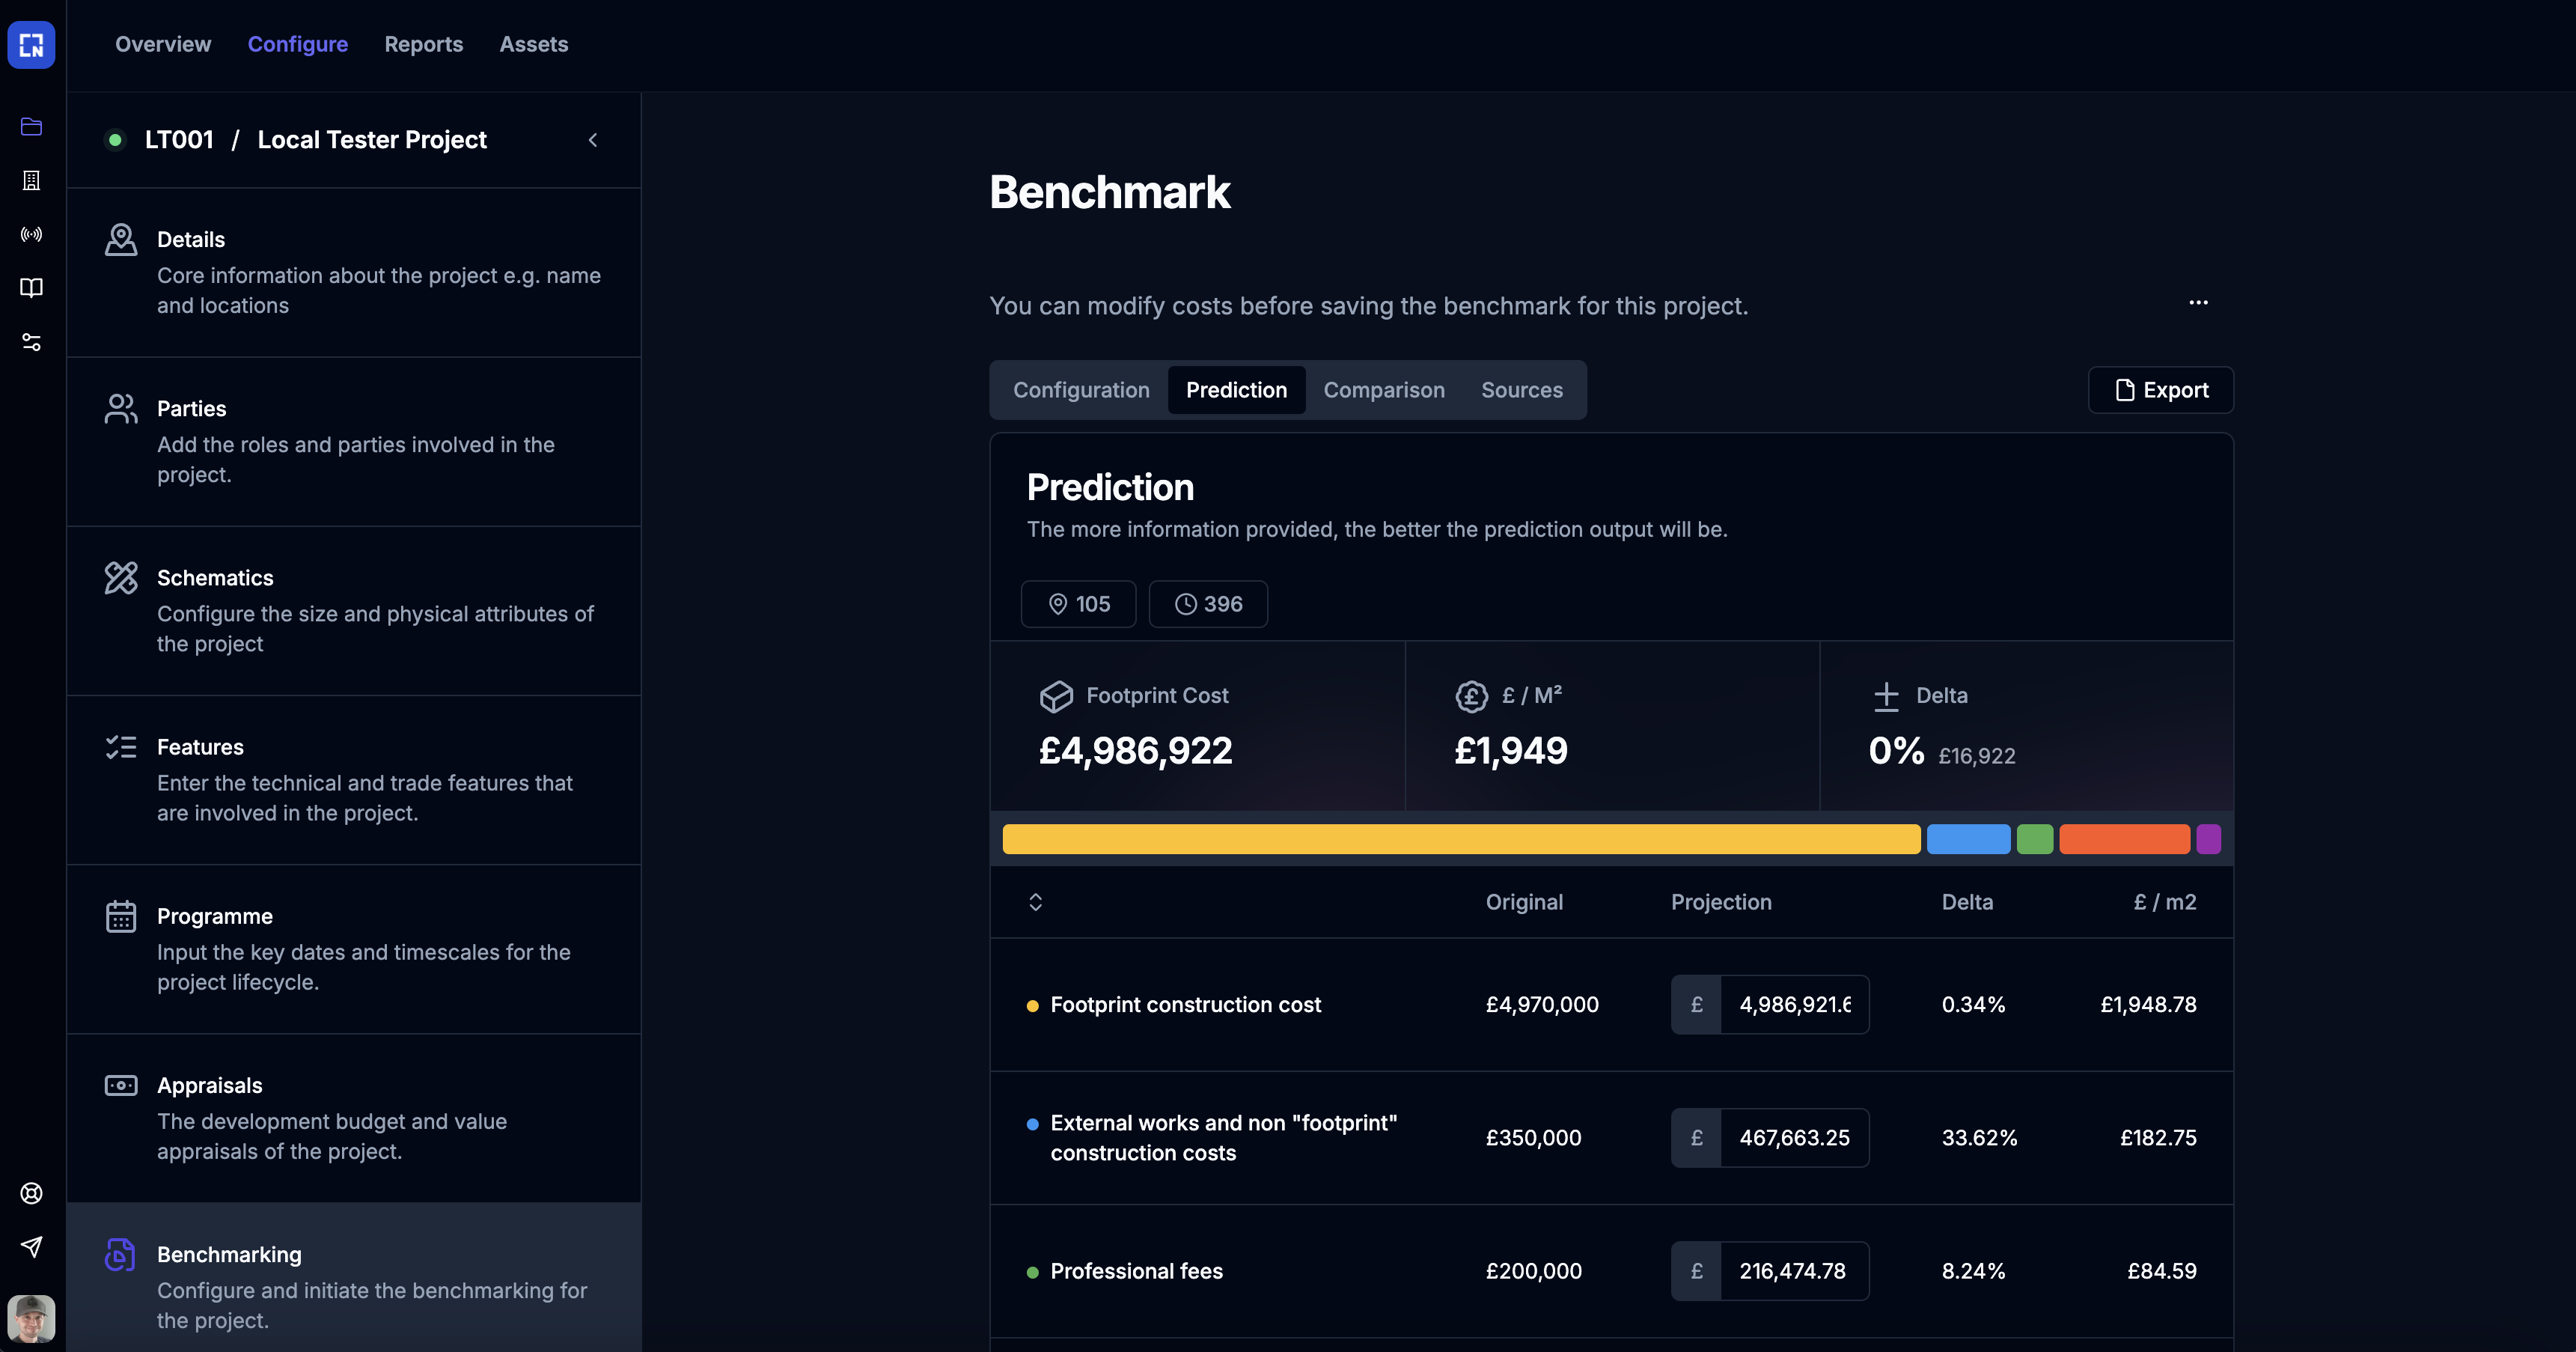
- Latitude and longitude
- Start date
- Total GIFA
- Footprint construction cost
- External works and non “footprint” construction costs
- Professional fees
- Contingency sum
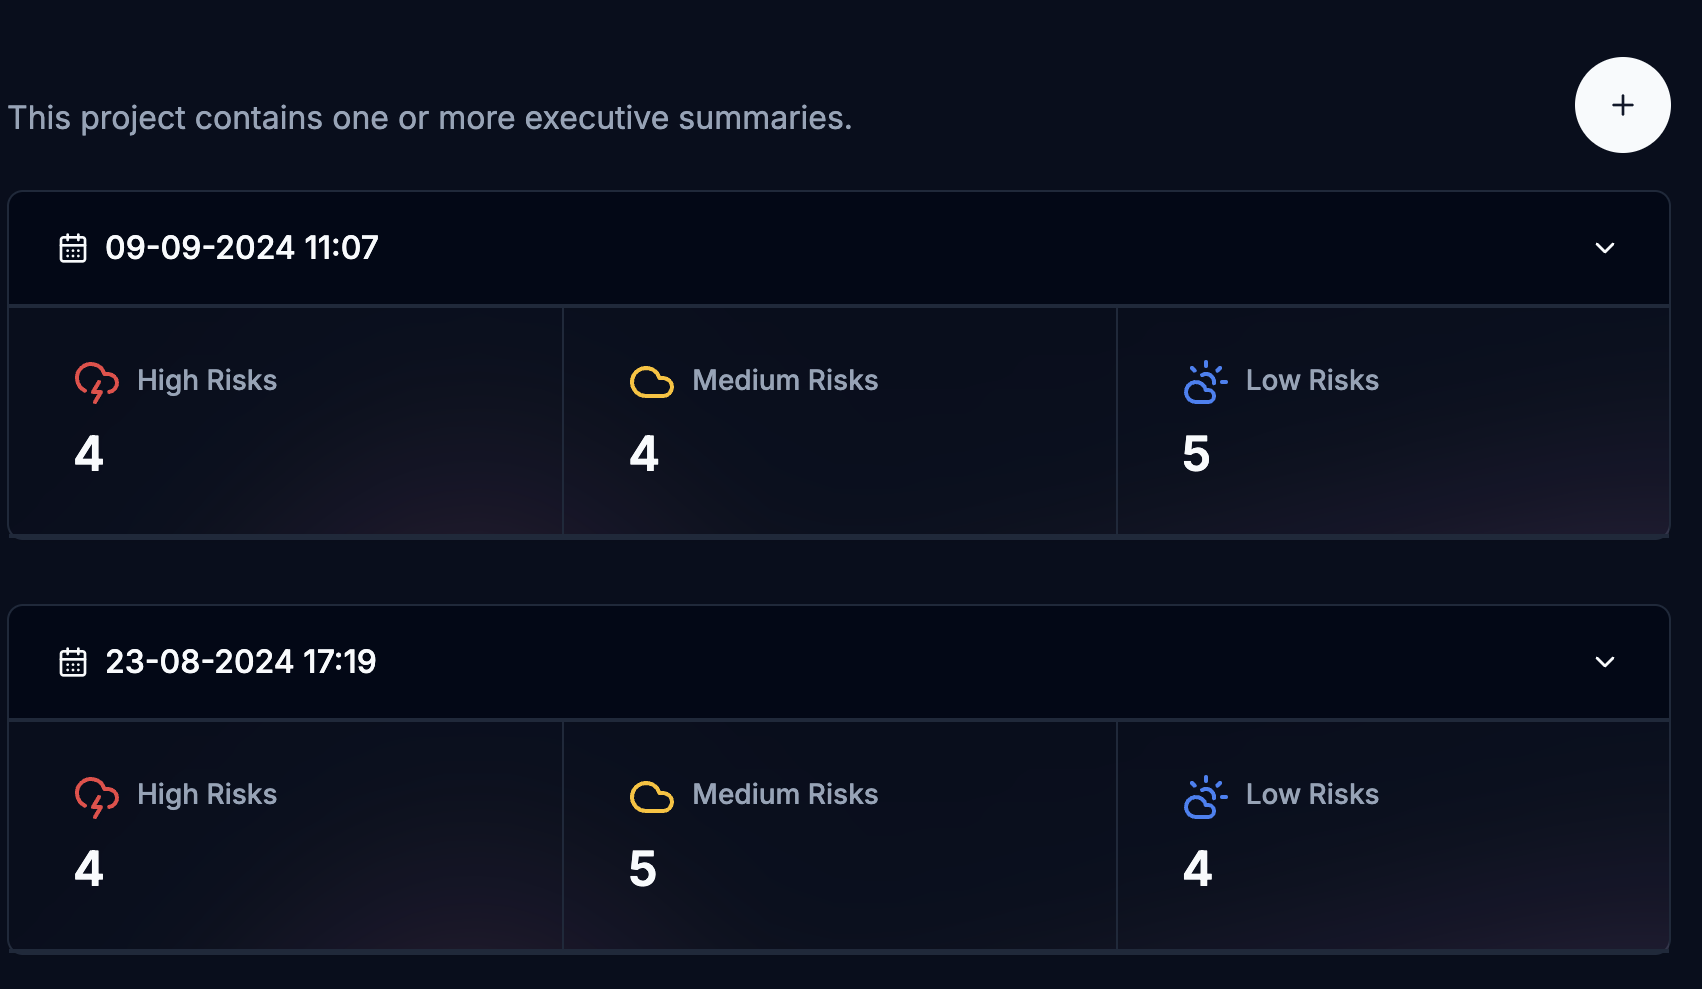
Executive Summary
This is the final step of project configuration.