Your project dashboard
ESG ratings, reports and completion tracking is currently unavailable.
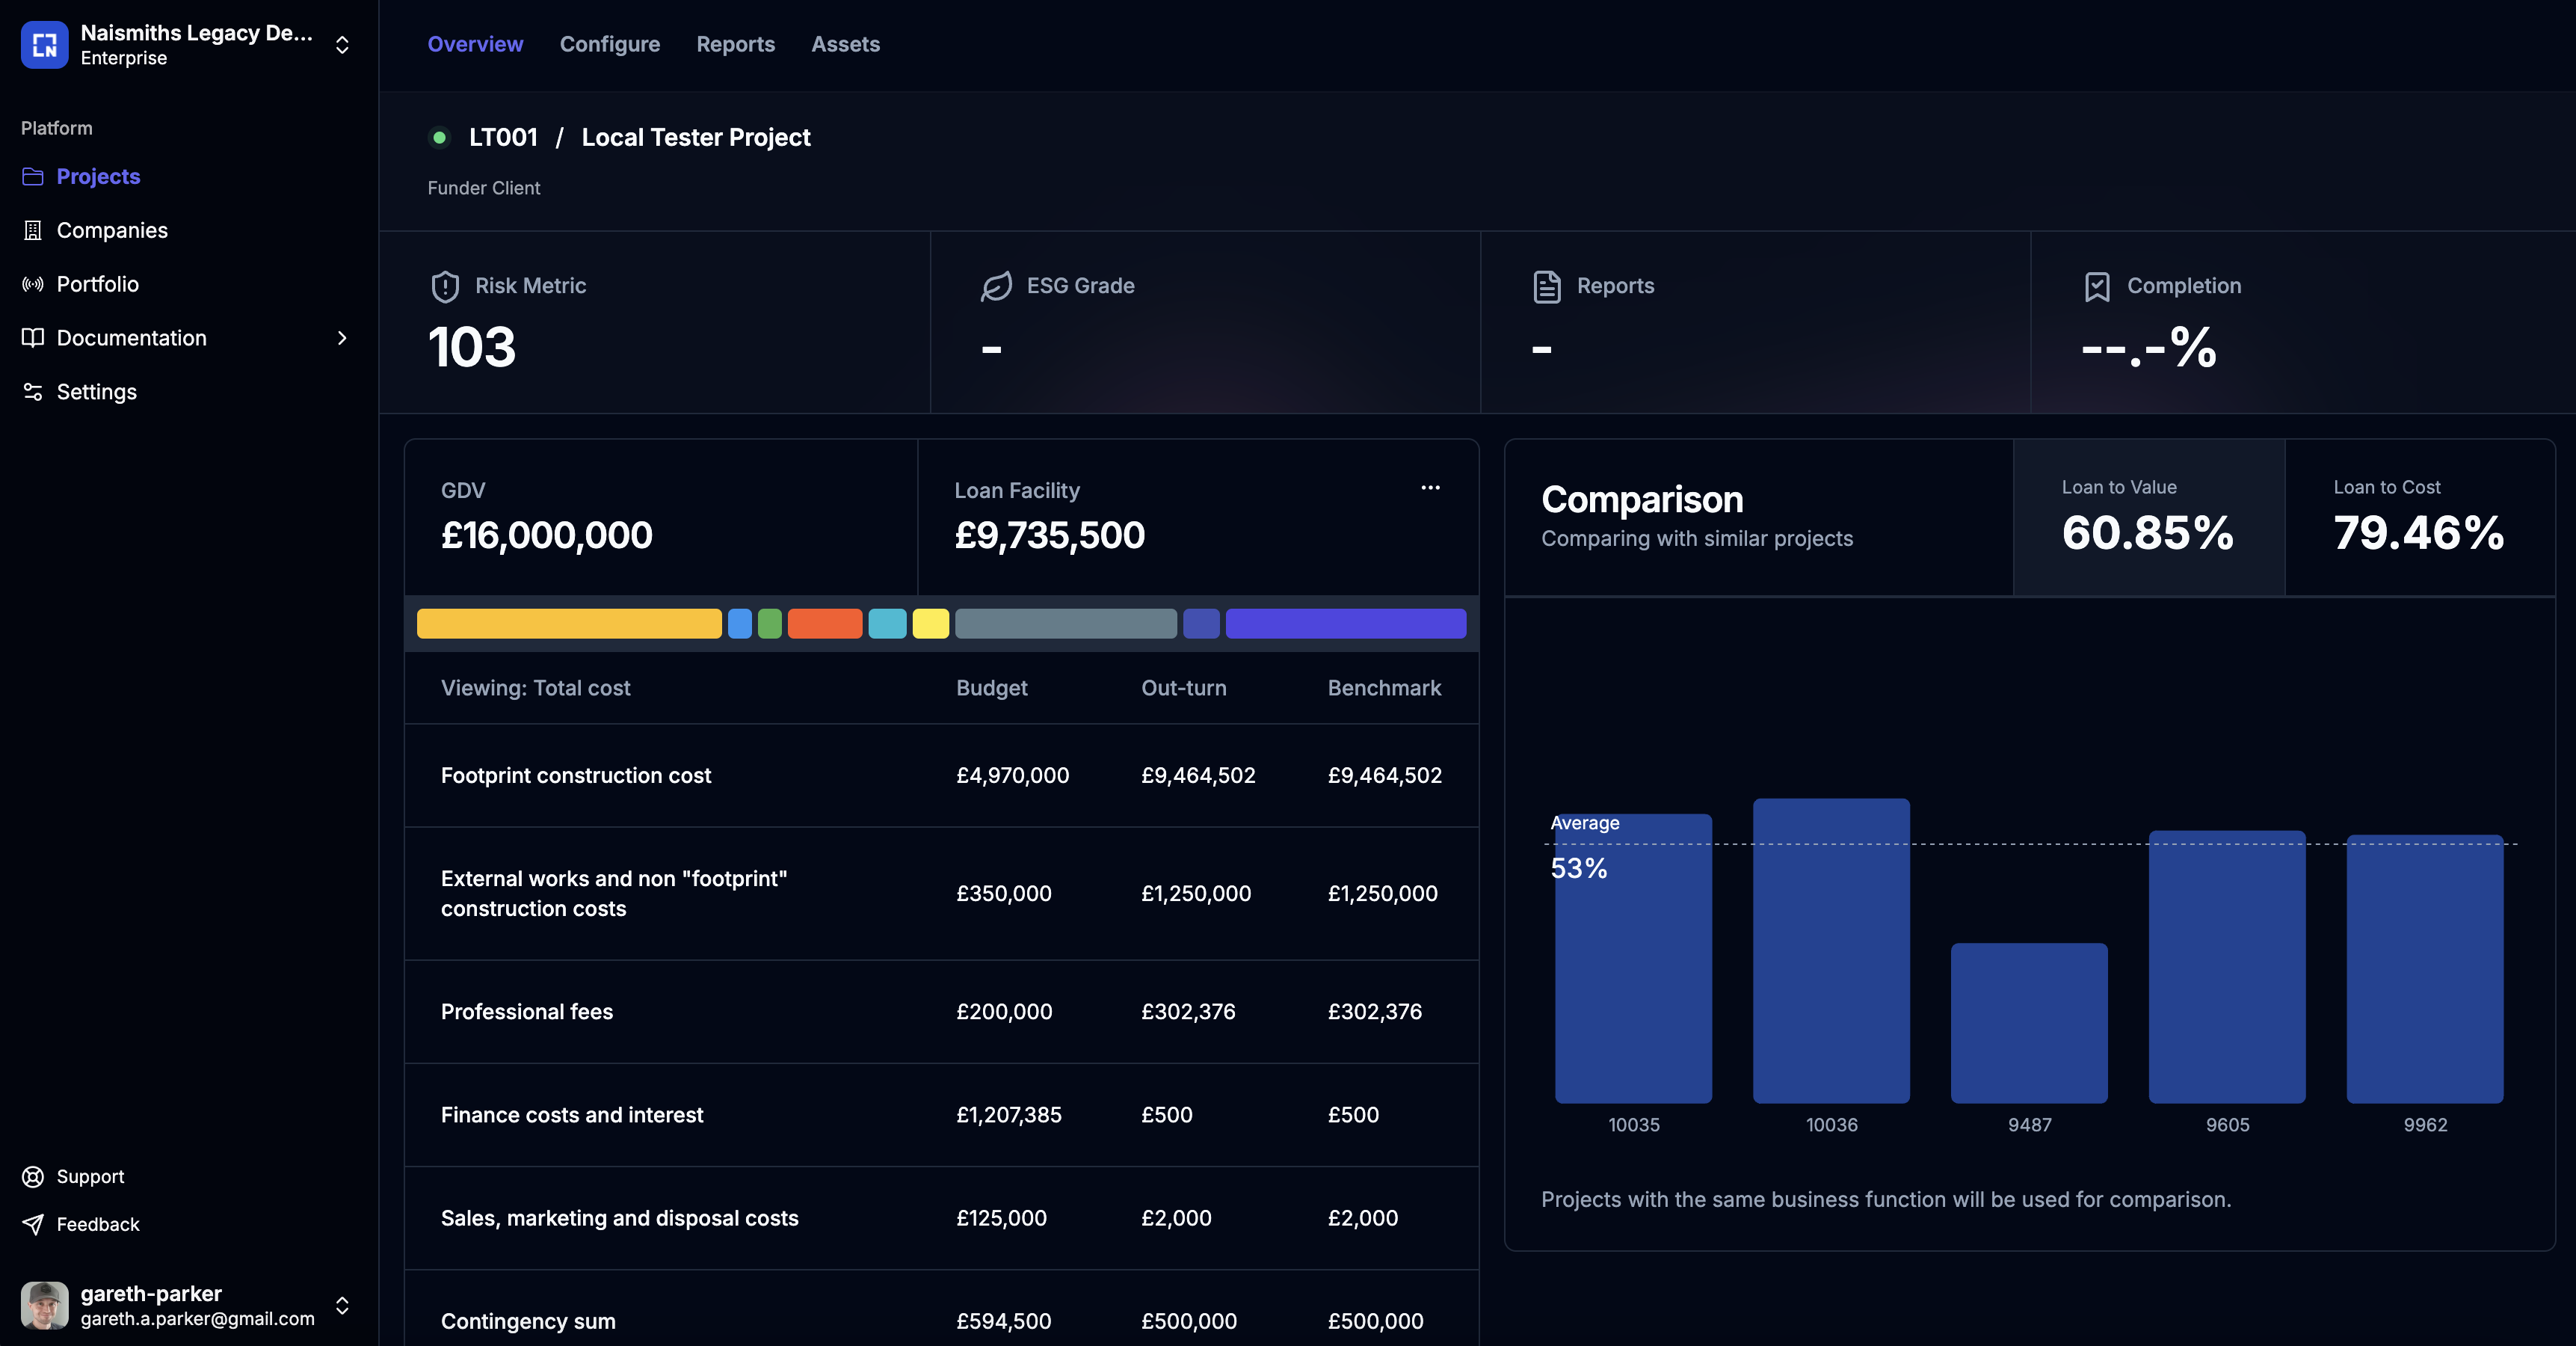
Risk Metric (Complexity) Score
N3 looks at various aspects of the project and calculates arisk metric score to easily identity which projects have high risk factors than others.
0-75
Scores in this range are very low risk and do not have any/many problematic
factors.
76-150
N3 has identified low to medium risk factors within the project.
151-250
This is a high risk project with many factors that pose risk to the
programme and budget.
251+
This is a very high risk score, and the project is expected to potentially
go over budget and take longer than expected.
Cost Inputs
Under the stat ribbon you can see your GDV and loan facility of the project. This card also includes the following:- View option controls
- Ratio of costs against the GDV
- Developer appraisal costs
- Prediction costs (Benchmarking)
- Out-turn costs